
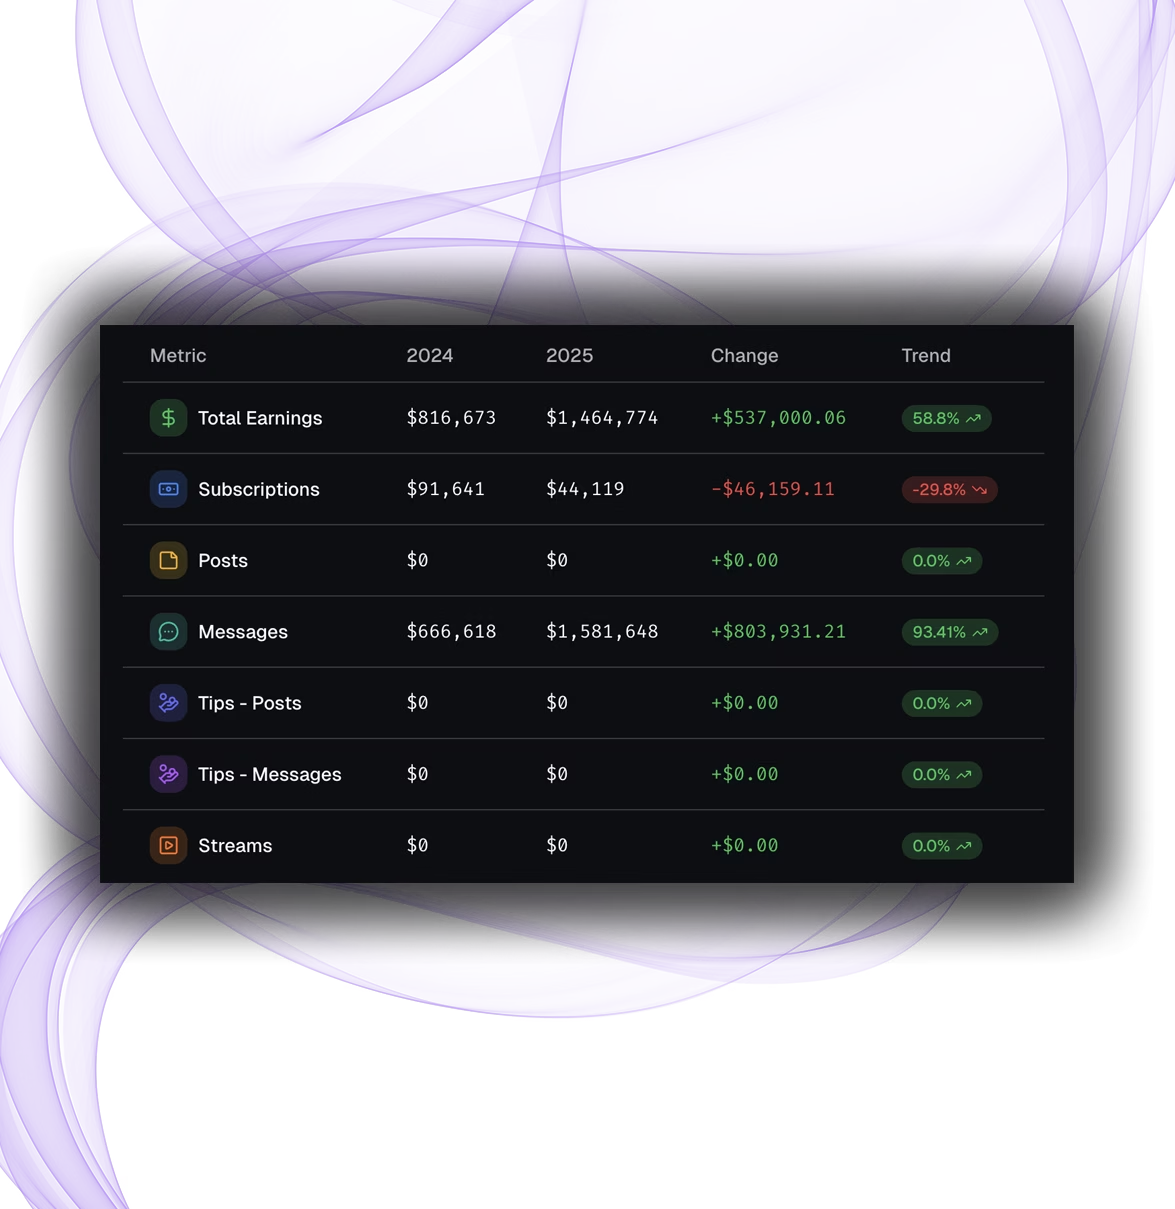
Earnings Overview
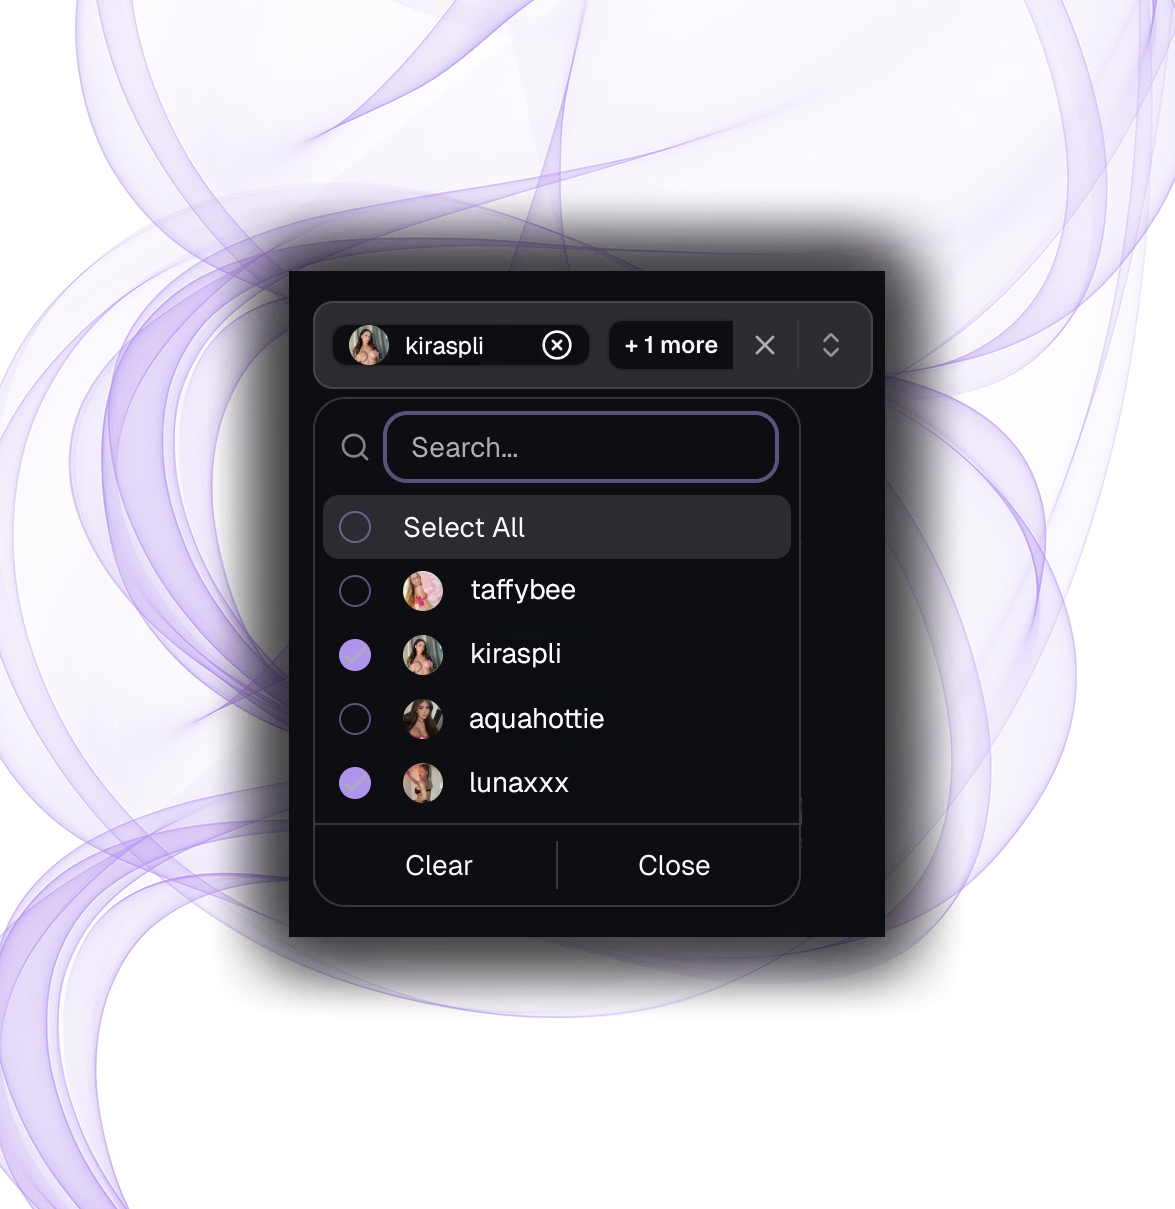
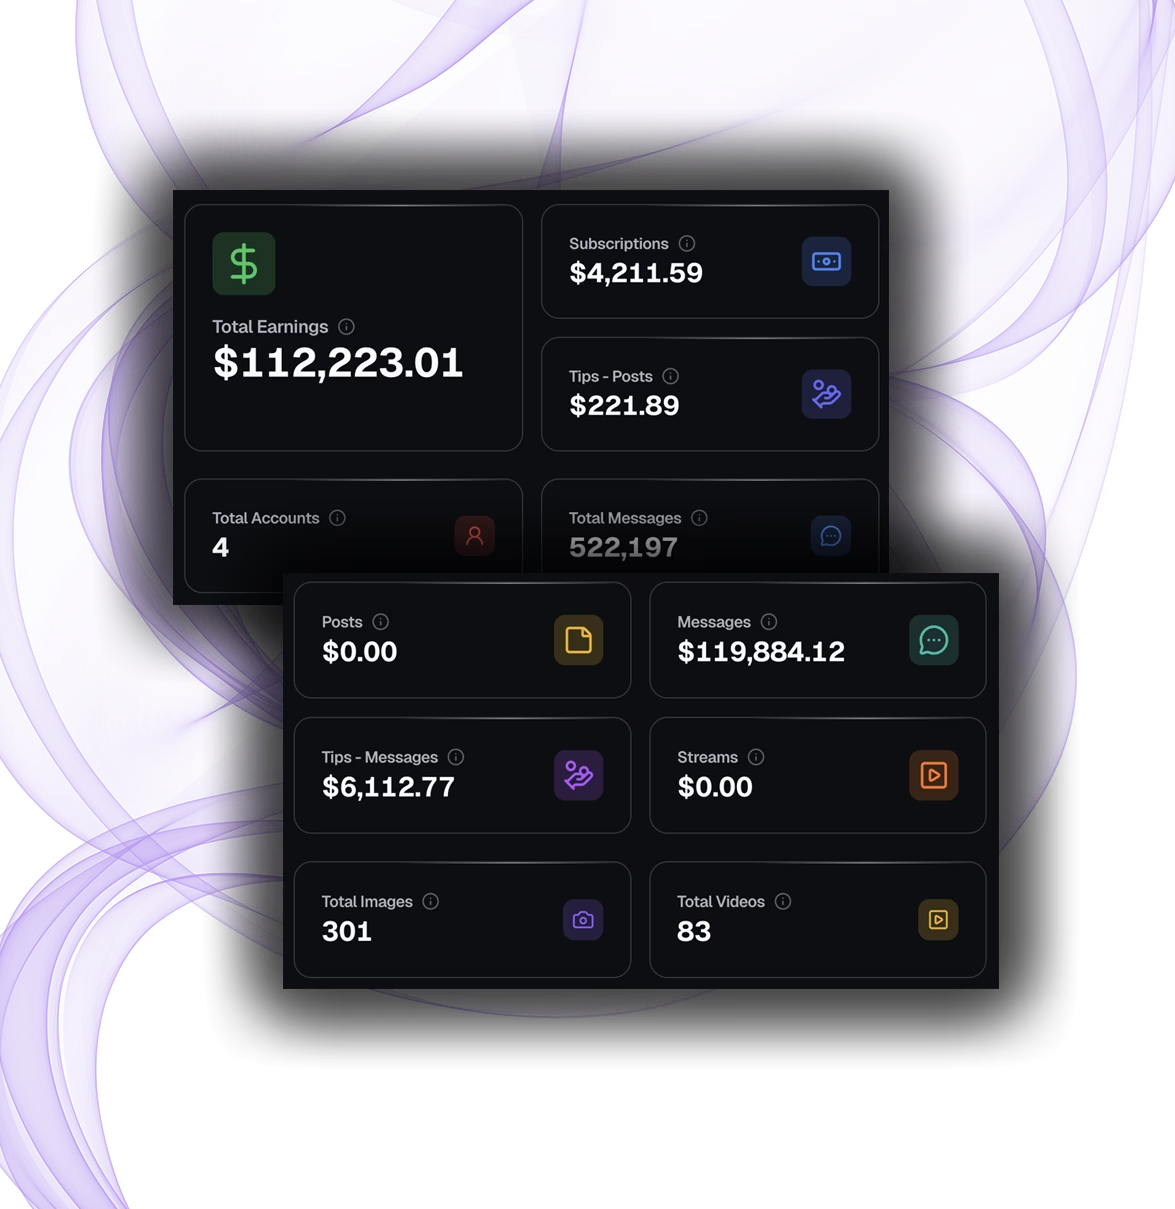
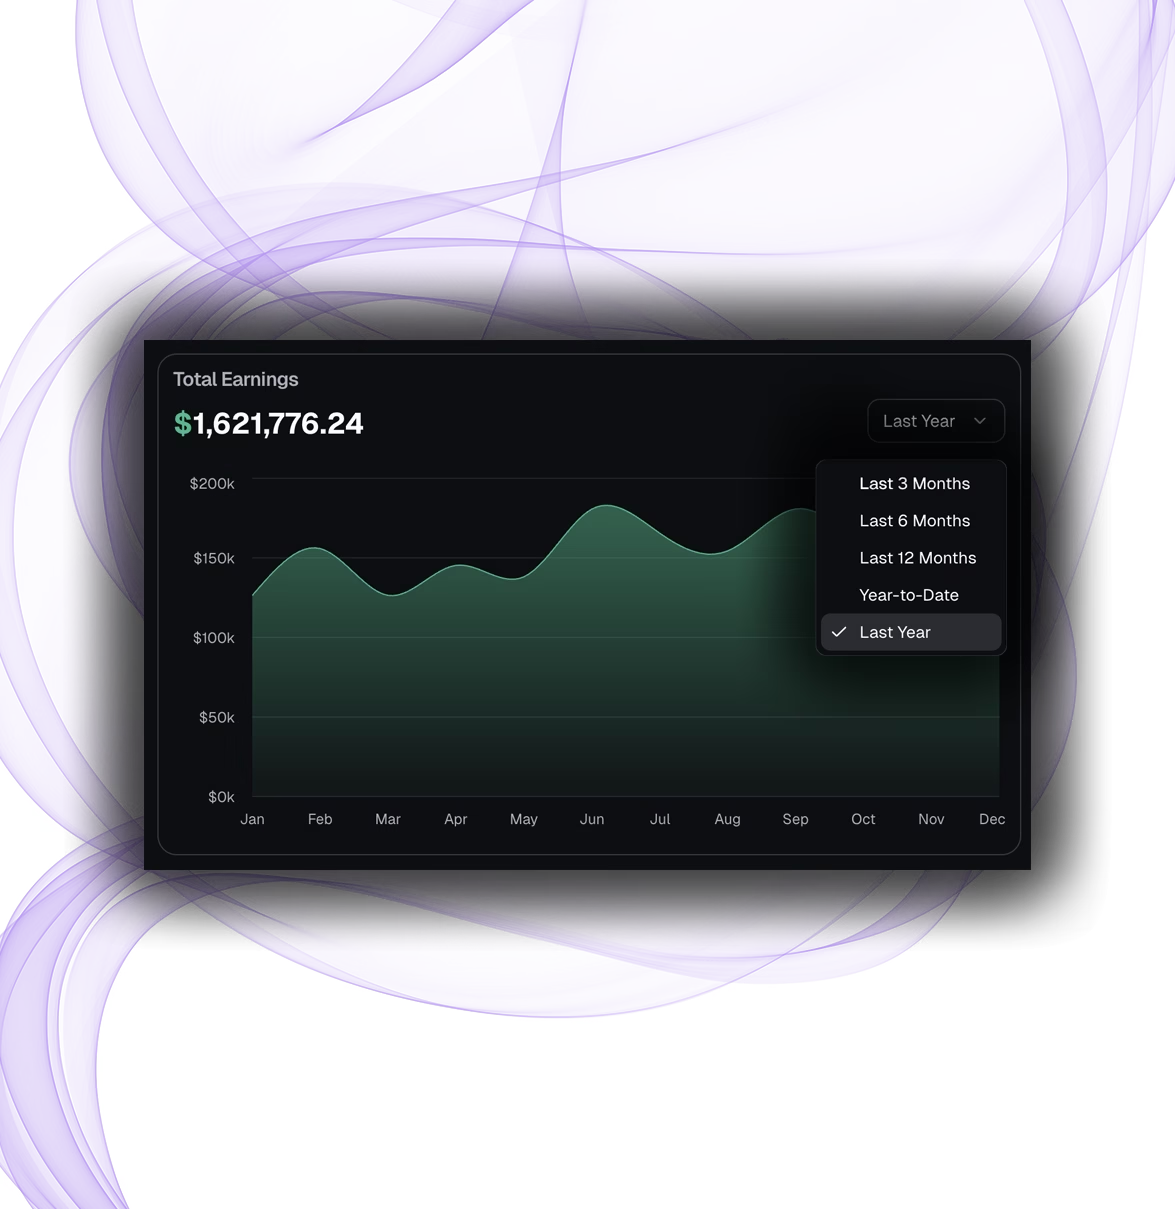
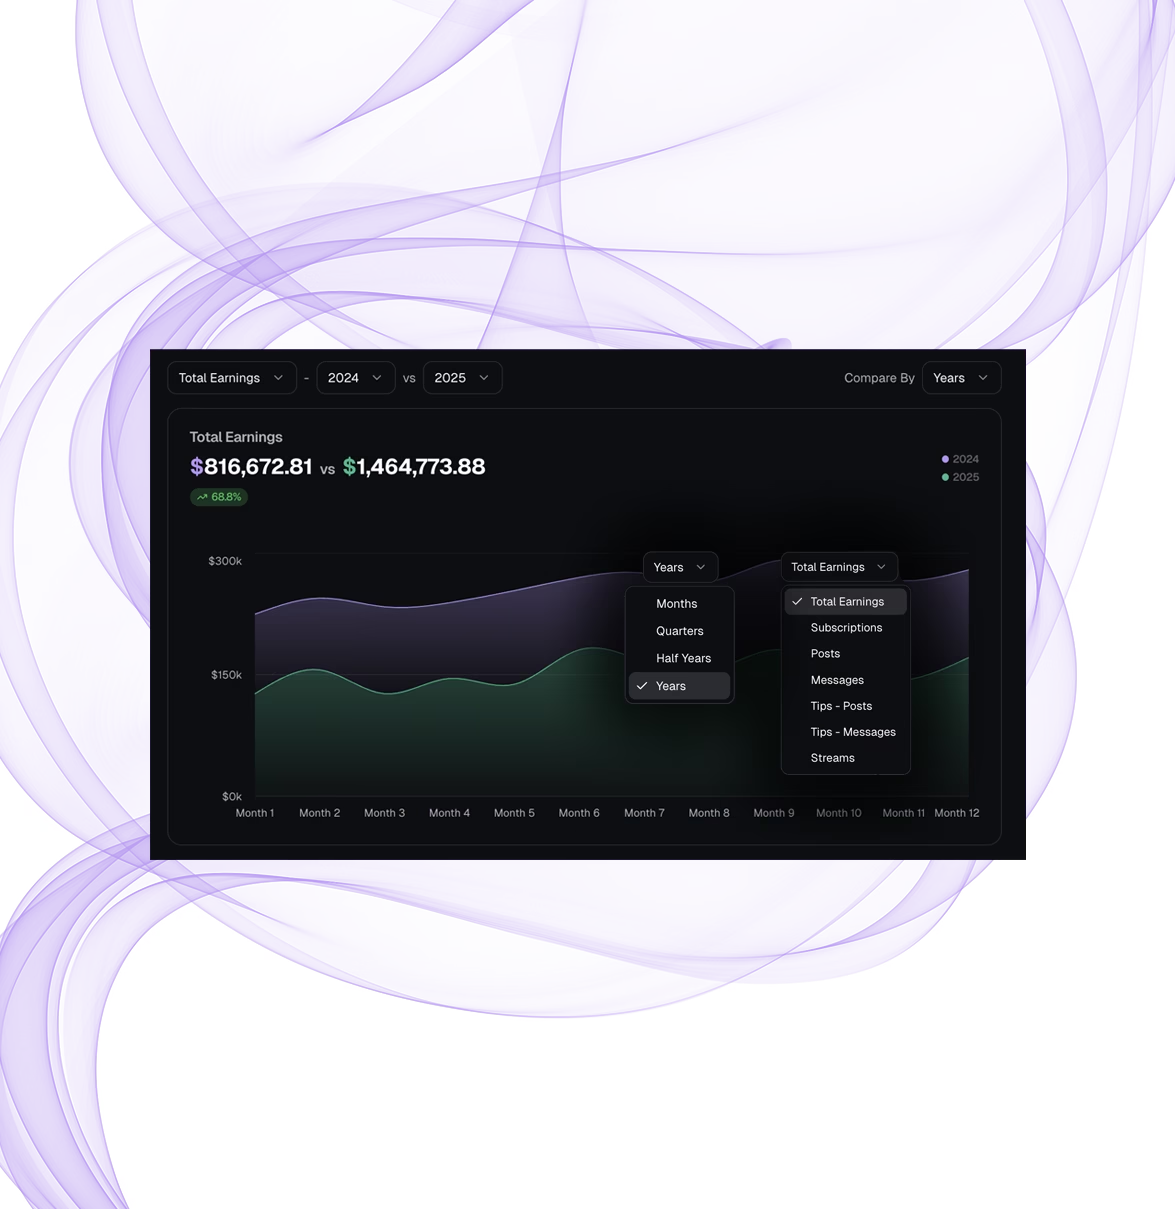
Pull total earnings and category-level breakdowns - subscriptions, posts, messages, tips, streams and content stats for any combination of accounts.
Earnings
Breakdowns
Content Stats
Key endpoints
POST
/api/analytics/summary/earnings